
The Recessionary Impact on Employer-Sponsored Health Coverage: Will it be Different this Time? Who Pays? How Much?
The COVID-19 pandemic exposed a much larger segment of Americans as being financially fragile – living paycheck to paycheck and unprepared for regular household expenses, let alone out-of-pocket medical expenses.
Now, compounded by a potential national recession, and coupled with an ever-increasing rate of inflation, employers and employees alike are at a level of heightened concern over the potential for significant increases in the cost of medical services, drugs, supplies and devices. Both employers and employees expect increases in the cost of coverage (employer and employee contributions) and in point of purchase cost-sharing (deductibles, copayments, coinsurance, etc.). Increasingly, Americans have become anxious over “what’s next” in terms of price increases and what will add to their financial stress thanks to the soaring cost of living.
“Most American workers would be surprised to find out that they pay more for other people’s health coverage than for their own.”
Health Care Spending
U.S. health care spending grew 9.7 percent in 2020, reaching $4.1 trillion or $12,530 per person. As a share of the nation’s Gross Domestic Product, health spending accounted for 19.7 percent. The acceleration in national health spending in 2020 was primarily due to a 36.0 percent increase in public expenditures for health care that occurred largely in response to the COVID-19 pandemic. Health care spending reached a total of $4.1 trillion.
Approximately $1 trillion was in the form of government pandemic relief, leaving $3.04 trillion for:
- Medicare: Medicare spending which grew at a rate of 3.5 percent to $829.5 billion in 2020
- Medicaid: Total Medicaid spending which experienced faster growth in 2020, increasing 9.2 percent to $671.2 billion
- Private Insurance (primarily employer-sponsored plans) which decreased by 1.2 percent in 2020 to $1.15 trillion. The decline resulted from a decline in enrollment and lower use of non-emergency health care as a result of the COVID-19 pandemic. Private health insurance enrollment fell by 1.7 million (-0.8 percent) and per-enrollee spending declined by 0.4 percent
- Out-of-Pocket: Out-of-pocket spending declined by 3.7 percent in 2020 to $388.6 billion
A Temporary Sugar High – The Inflationary Impact of Stimulus Checks
The American Rescue Plan Act of 2021 (American Rescue Plan), enacted in early March 2021, provided Economic Impact Payments of up to $1,400 for eligible individuals or $2,800 for married couples filing jointly plus $1,400 for each qualifying dependent, including adult dependents. Tens of millions of Americans received checks as part of the COVID-19 relief bill, providing emergency financial aid to individuals and families whether or not they themselves suffered economic insecurity due to the pandemic.
How effective were those stimulus checks? Some argue the money may have fueled inflation and led many to a false sense of financial relief and empowerment. Did economic stimulus really help everyone who needed it most, and is it a factor in today’s high inflation?
There is evidence that the stimulus likely stoked higher prices for the very people it was intended to help. Recent analysis from researchers at the Federal Reserve Bank of San Francisco found that the stimulus may have raised U.S. inflation by about three percentage points by the end of 2021. (Source: Federal Reserve Bank of New York. As of Q2 2021.) Keep in mind that the CPI for 2021 was “only” 7%, so, because those payments didn’t show up until March – April 2021, nearly half of the 2021 inflation may be attributable to the stimulus.
The stimulus encouraged spending that likely raised the standard of living for some, perhaps many consumers, often to an unsustainable level. Once those monies are exhausted, some fall back on access to credit. Household debt was $15 trillion in the second quarter 2022, the highest in 14 years. Non-mortgage debt is at an all-time high.
Inflation has outpaced wage growth. Through June 2022, average real weekly earnings are down 4.4% over the past 12 months – from the combination of inflation and a reduction in the average number of hours worked. That’s the largest reduction in real wages since the 1970’s.
The Producer Price Index (PPI) program measures the average change over time in the selling prices received by domestic producers for their output. The producer price index rose 11.3% from a year ago in June, near the record 11.6% posted in March. Excluding food, energy and trade, core PPI was up 6.4%. This suggests that inflation for consumers will continue to increase in 2022.
Why is the PPI important? It measures inflation from the perspective of costs to industry or producers of products. Because it measures price changes before reaching consumers, some people see it as an earlier predictor of inflation than the Consumer Price Index (CPI). The CPI includes only components of personal consumption directly paid for by the consumer. In contrast, the PPI for personal consumption includes elements of personal consumption that are not paid for by the consumer.
Recession Reality sets in this Summer
Gross Domestic Product (GDP) measures the value of the final goods and services produced in the United States (without double counting the intermediate goods and services used to produce them). Changes in GDP are the most famous indicator of the nation’s overall economic health.
Real GDP decreased at an annual rate of 1.6 percent in the first quarter of 2022, according to the “third” estimate released by the Bureau of Economic Analysis and decreased at an annual rate of 0.9 percent in the second quarter of 2022, according to the “advanced” estimate released by the Bureau of Economic Analysis. The “second” estimate for the second quarter, based on more complete data, will be released on August 25, 2022.[i]
June health plan renewals suggest high single-digit rate increases for medical coverage in 2023. However, more recent anecdotal data suggests many, perhaps most plans will see double digit rate increases for 2023.
Will it be different this time?
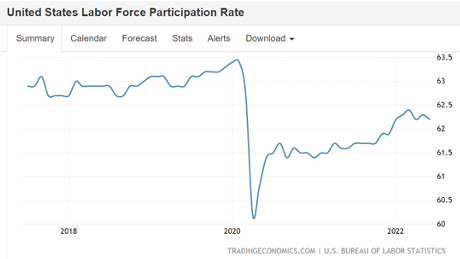
As stimulus checks were deposited, a record number of workers quit their jobs, creating the so-called “Great Resignation.” Importantly, the civilian labor force participation rate of 62.2% of adults remains below pre-pandemic levels.[ii]
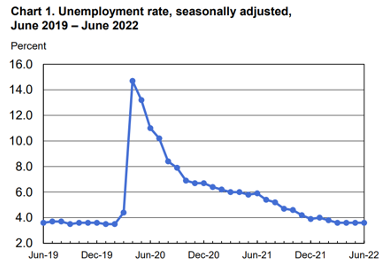
While fewer people are in the labor force compared to pre-pandemic levels, unemployment continues to be at historically lower levels.[iii]
Most Americans who want to be employed still have jobs. Sending out federal stimulus checks, regardless of work status, failed to target those actually in need.
A recession traditionally lowers employment, in turn lowering the number of Americans who secure health care coverage through employer-sponsored plans. However, this recession may not be like other recessions. This may be, technically-speaking, our first ever “full employment” recession. That’s the likely statistical anomaly from a combination of factors:
- Labor force participation at 62.2%, where those who have left the labor force as part of the Great Recession are not counted in the employment/unemployment data,
- The 3.6% unemployment rate, and
- The addition of 372,000 jobs in June 2022.
Employer-sponsored coverage is the most common way Americans obtain health insurance coverage. However, enrollment in taxpayer-subsidized health plans is, for the first time in history, comparable to enrollment in employer-sponsored plans.
Taxpayer-subsidized health coverage is also available for people with incomes below certain levels – often at reduced or no cost. Examples include Medicaid and the Children’s Health Insurance Program (CHIP). Marketplace insurance plans with premium tax credits are also forms of subsidized coverage.
There is an explosion in people covered by these taxpayer-subsidized options – an increase of 34% in Medicare since 2010, 60% in Medicaid, while enrollment in public exchange coverage has reached 15 million.
Shockingly, in addition to the cost of their own employer-sponsored coverage, most taxpayers are also paying the cost of Medicaid coverage for 15 million ineligible Americans. In March 2020, Congress barred states from kicking ineligible people off Medicaid rolls during the COVID emergency. The Urban Institute projects that up to 15 million ineligibles will lose Medicaid coverage when the COVID emergency declaration ends.
So, Who Pays, and How Much?
Most American workers see a greater reduction in their take home pay to finance the health coverage for others than they do for their own.
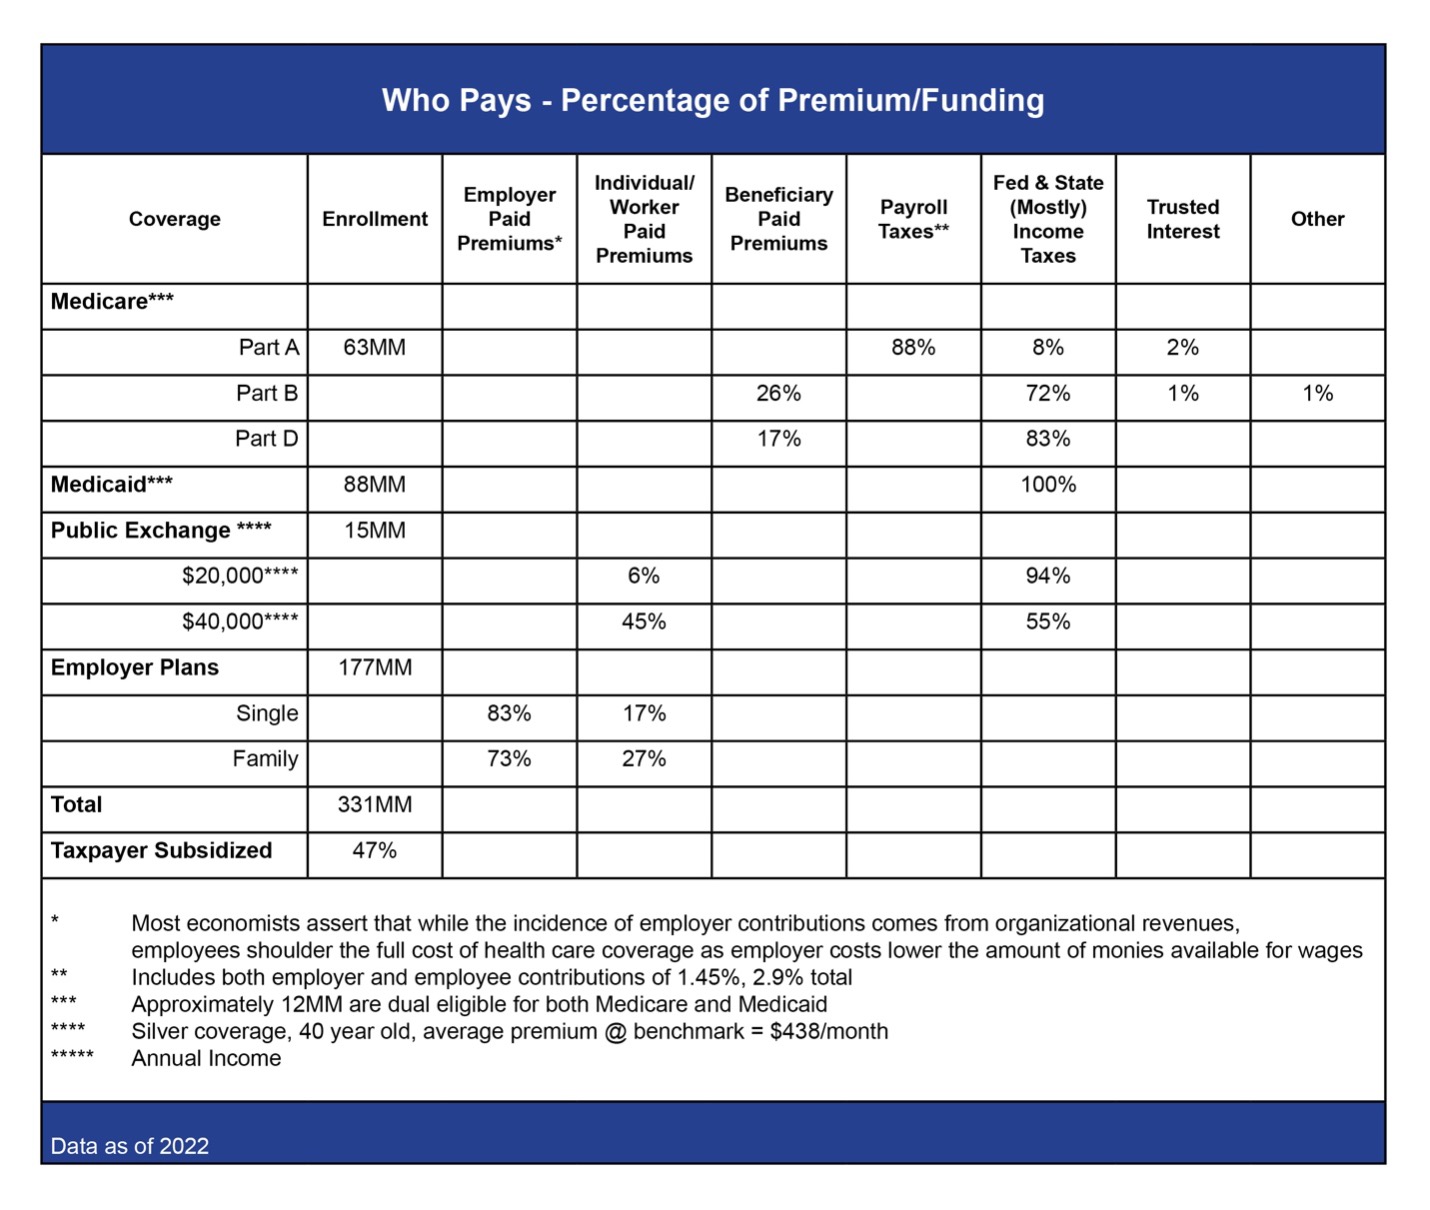 Figure 1. “Who Pays?” What is the source of funding for medical coverage in the United States? As you can see, almost everything comes either directly or indirectly from taxpayers, where most of the burden is on deductions from wages in the form of employee contributions, payroll taxes and income taxes.
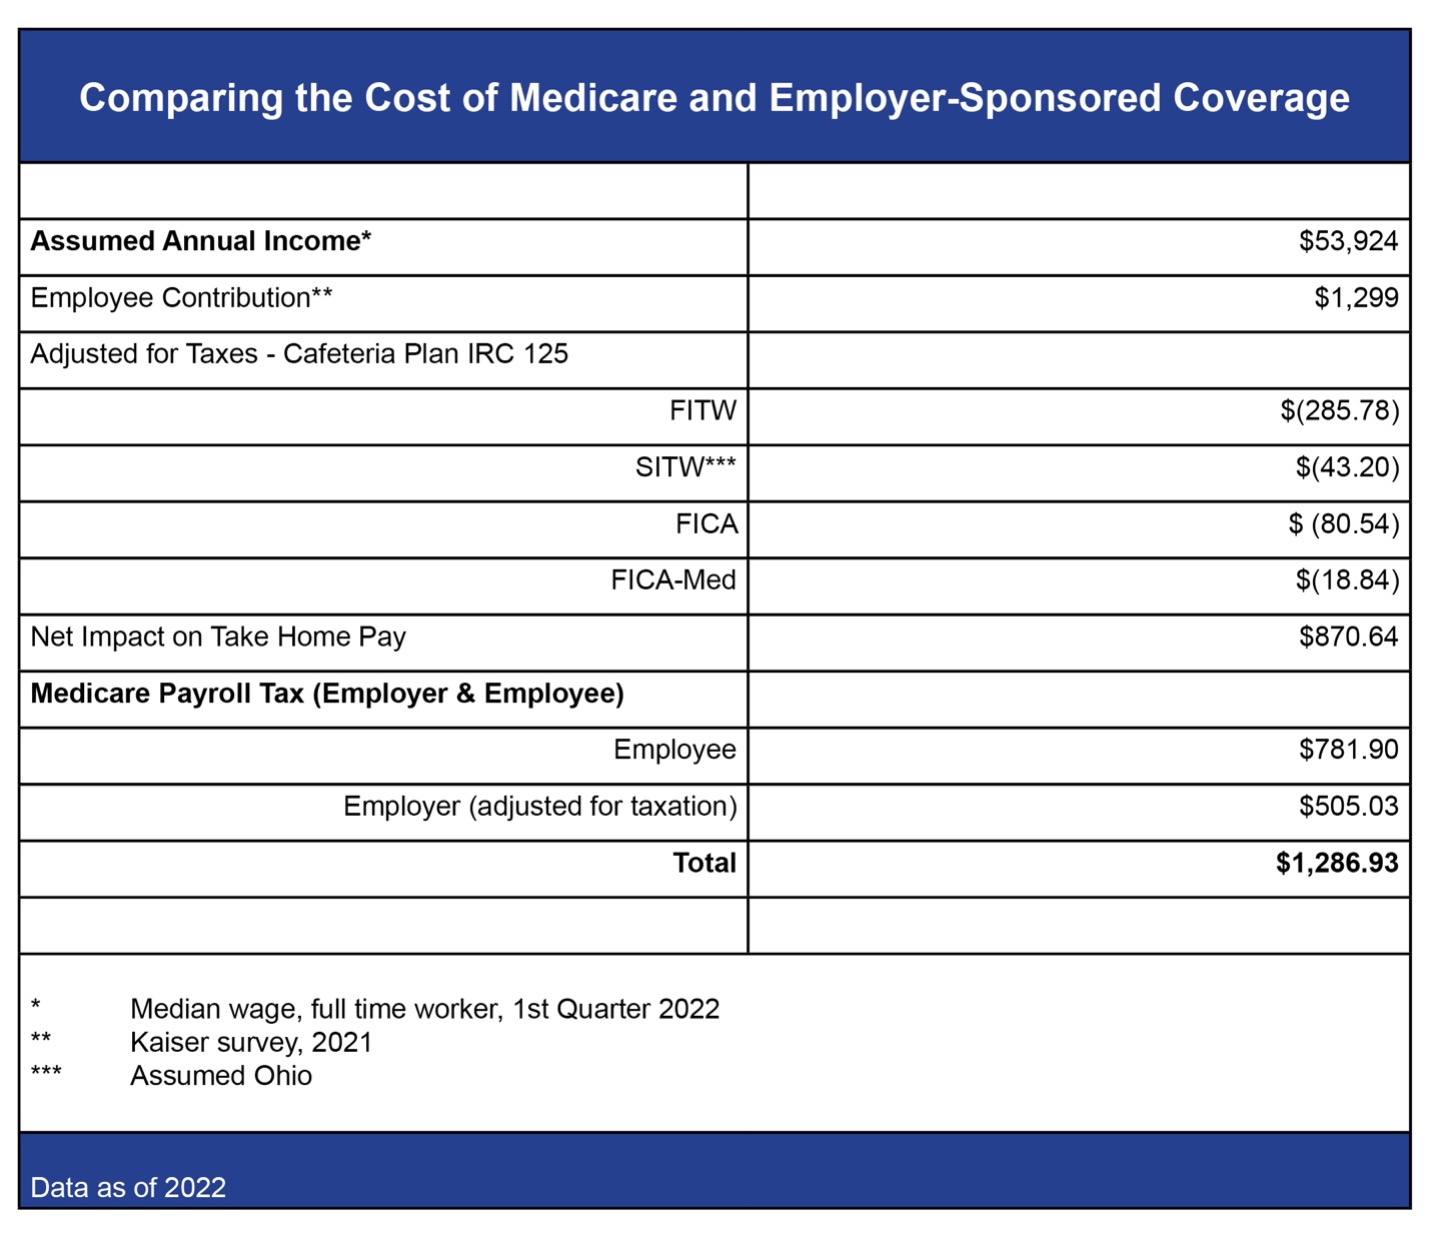 Figure 2. “How much?” This table shows a simple comparison using median wage income for a full-time worker and Kaiser data to confirm that take-home pay for the median wage earner in America, once adjusted for taxes, is reduced more for Medicare payroll taxes than for her own employee contribution.
In the second table, you must attribute the economic impact of the employer contribution to the cost of Medicare Hospitalization Insurance. It is, over the long haul, a reduction in wages employers pay to employees. Employee contributions for Medicare come out of post-tax take home pay – it is not collected on a pre-tax basis, and it is not tax deductible. The employer contribution to Medicare must be adjusted for federal, state and local income taxes, and FICA and FICA-Med because the employer-paid Medicare premium is not attributed as taxable wages to the worker.
Employer Sponsored Health Plans need to take a holistic approach to employee health benefits. Plan administrators and brokers should take strategic action and make changes that ensure that their employer-sponsored, self-insured plans incorporate the most effective strategies available to address today’s economic challenges to the “health and wealth” of their participants. These strategies include effectively designed acquisition cost-based pharmacy pricing, HSA-capable coverage, reference-based pricing, adequate participant protections against balance billing, participant advocacy, and litigation support.
As your partner, aequum is here to help lower costs, achieve savings and support your plan’s member experience and success in 2022 and beyond. Please contact us if you have any questions or need support. For more information, visit https://aequumhealth.com.
Sources
- Public Exchange https://www.healthinsurance.org/glossary/public-exchange/
- Medicare https://www.medicare.gov
- Medicaid https://www.medicaid.gov
- Dual Eligible https://www.macpac.gov/topics/dually-eligible
- Internal Revenue Service https://www.irs.gov
- Ohio Department of Taxation https://tax.ohio.gov
- https://www.kff.org/private-insurance/issue-brief/how-aca-marketplace-premiums-are-changing-by-county-in-2022/
- https://www.kff.org/medicare/issue-brief/the-facts-on-medicare-spending-and-financing/
- https://files.kff.org/attachment/Summary-of-Findings-Employer-Health-Benefits-2021.pdf
- https://www.ahip.org/documents/202204-CaW_EPC-Demographics-v02.pdf
- https://www.kff.org/medicaid/issue-brief/medicaid-financing-how-does-it-work-and-what-are-the-implications/
- https://files.kff.org/attachment/Summary-of-Findings-Employer-Health-Benefits-2021.pdf
- https://healthy.kaiserpermanente.org/shop-plans
- Median Weekly Wages – BLS https://www.bls.gov/news.release/pdf/wkyeng.pdf
- Pass Through – Incidence vs. Impact – Payroll Taxes https://www.cbo.gov/system/files/2021-06/57089-Payroll-Taxes.pdf
[i] www.bea.gov/news/2022/gross-domestic-product-second-quarter-2022-advance-estimate
[ii] Trading Economics, United States Labor Force Participation Rate. The civilian labor force participation rate is the number of employed and unemployed but looking for a job as a percentage of the population aged 16 years and over., Accessed 7/14/22 at: https://tradingeconomics.com/united-states/labor-force-participation-rate#:~:text=Labor%20Force%20Participation%20Rate%20in%20the%20United%20States%20averaged%2062.85,percent%20in%20December%20of%201954.
[iii] US Department of Labor, Bureau of Labor Statistics, The Employment Situation, 7/8/22, Accessed 7/14/22 at: https://www.bls.gov/news.release/pdf/empsit.pdf